If you restore your phone you have to do this again.
background: shorturl.at/akqR9
method by schmeerio at reddit: shorturl.at/jmotx
Saturday, August 17, 2019
Monday, March 25, 2019
Jeff Saut on Recent Market Activity
INVESTMENT
STRATEGY | PUBLISHED BY RAYMOND JAMES & ASSOCIATES MARCH
22, 2019 | 8:15 AM EDT
So the question du jour yesterday was, “Hey Jeff, was that it? Was that the pullback you were looking for?” My answer read like this: "Well, the S&P 500 pulled back from an intraday high of ~2853 to an intraday low of ~2812 for a 1.4% decline. Additionally, it pulled back into my often mentioned 2800 – 2830 support zone. However, I will not be able to determine if ‘That was it’ until I run my indicators tonight (that would be last night). As of this writing, it is too early (5:00 p.m. on Thursday) to run those indicators, more on that tomorrow morning when I warp into my trading turret around 4:30 a.m."
...
Also of interest is the continued outflows of money from the actively
managed mutual funds, which is a sure signal that is a wrong-footed
move. Indeed, as one particularly bright portfolio manager emailed me
yesterday:
"If
the economy is as weak as many are concluding after the Fed’s very
dovish message yesterday then commodity prices should be rolling over
and credit spreads blowing out, but that is definitely not the
message those market signals are sending you. It seems as though the
Fed is encouraging risk taking again. Like they are bringing back the
punch bowl and asking us all to take another sip. So in my book you
use any short term confusion in the Fed’s messaging to add to risk:
global equities, below IG credit, and EM equity and debt. In my
humble opinion I think this ultimately sets us up for further melt-up
in equities."
Plainly, I agree.
So on Wednesday, on set, CNBC asked me, “What shocked you about today’s FOMC communique” I responded that in the 55 years I have been observing markets I cannot recall ANYTIME the Fed has telegraphed that it would not be raising interest rates the rest of the year! If somebody reading this can recall such an event, please email me. And for those that think we are headed for a recession, please take a look at the Bloomberg Financial Conditions Index (chart 3 on page 3). *
Yesterday’s Dow Wow, as reprised by my friends at the sagacious Lowry’s Research Organization:
"The
DJIA and S&P 500 roared back today from the losses suffered over
the prior two sessions with gains of 0.84% and 1.09%, respectively.
However, market internals failed to match the price gains as Up
Volume was a mediocre 65% of total Up/Down Volume while Advances were
a more respectable 72% of total Advance and Decline Issues.
Similarly, Buying Power gained just 1 point today, matching its
recent rally high at 178 although with its 2 point decline Selling
Pressure reached a new reaction low at 93."
*

Excellent comments on recent market/Fed action
A Missing Caveat to Last Week’s Sell-Off
First of all, congratulations to my friend Ari Wald on the fifth anniversary of his weekly technical note, Inflection Points, for Oppenheimer & Co. I’ve been reading him since the beginning and posting his insights often here at TRB.
Ari makes sense of the price action and market cross-currents in a helpful, non-pedantic way, with enough detail for serious technicians but not so much so that you can’t understand what he’s saying. And his charts are always illuminating, no matter what’s going on.
Okay, here’s what Ari wants you to know about what we witnessed last week – a sell-off in the 10-year treasury yield that led to an inversion, along with the typical bludgeoning of the bank stocks that need a positively sloped curve…
It was ugly, but it doesn’t scream “TROUBLE!” for the US economy or the financial system. Ari chalks up the drop in rates to a technical follow-through for what’s happened with the German 10-year (negative yields again). Most importantly, there are no signs of credit stress in the major indicators, which is key if you’re buying on the dip…
No Signs of Major Credit StressThe cautionary drop in interest rates isn’t being confirmed by signs of major stress in high-yield credit spreads either, by our analysis. While high yield has underperformed both Treasuries and corporate bonds in March, weakness hasn’t been meaningful in relation to the year-to-date outperformance going into this March peak; i.e., it’s been within trend, in our view. It’s also interesting to note that while banks have been a key underperformer in the equity market since the start of the month, the industry has surprisingly outperformed within the high-yield market.

Ari goes on to show that, for the month of March, high-yield bonds issued by banks are the top total return performing credits, still up 1.8% in March versus the return for the entire high-yield index of just .7%. So if you thought people were selling assets out there because they think there’s some fundamental issue with the economy or the financial system, you’d be very wrong.
Ari’s take is that we’re back to lower growth expectations, which is not the same as a recession, and that this environment should favor the equities that have faster-than-market secular growth stories (think Microsoft, Amazon, Alphabet, etc) and the SaaS stocks. If they keep getting cheaper because the market is focused on the problems in Europe, that’s the pitch you’ve been waiting for, perhaps. US investors will come back to them if they keep exceeding the growth to be found elsewhere.
Source:
Inflection Points
Oppenheimer & Co – March 23rd, 2019
Oppenheimer & Co – March 23rd, 2019
Monday, January 21, 2019
What is MMT (Modern Monetary Policy) - from Brad DeLong
By Popular Demand: What Is “Modern Monetary Theory”?
What Is “Modern Monetary Theory”?
Ever since the Great Depression it has been settled doctrine in the nations of the North Atlantic that the government has a responsibility to keep the macroeconomy in balance: The circular flow of spending, production, and incomes should be high enough to keep there from being unnecessary unemployment while also being low enough so that prices and inflation are not surprisingly and distressingly high. To accomplish this governments use fiscal policy—the purchase of goods and services, the imposition of taxes, and the provision of transfer payments—and monetary policy—the provision by the central bank to the system of those liquid assets called “money” and its consequent nudging up and down of interest rates and asset prices—to attempt to keep the circular flow of spending, etc., in balance at the expected rate of inflation with the economy‘s sustainable productive potential.
Modern Monetary Theory says that that is all there is to worry about, and that fiscal policy should play the principal role in this balancing process. Is there excessive unemployment? Then the government should boost its purchases and cut its taxes.
How will we know that we have gone too far in doing this? Rising inflation will tell us—when we see the whites of rising inflation‘s eyes, Then will be the time to cut purchases and raise taxes.
Are there rational worries that the interest payments on the outstanding national debt are too high? Then, Modern Monetary Theory says, expand the money supply to push down interest rates and so will make it possible for the government to refinance its debt on sustainable terms.
Does that expansion threaten to cause excess inflation? Then deal with that stress the normal way a government following Modern Monetary Theory deals with incipient inflation: cut government purchases and raise taxes until the macro economy is back in balance.
This is the macro economic policy management gospel That I have a learner preached during and after World War II under the name of “Functional Finance“. It is a good gospel—much better than the ravings of those yahoos who nearly a decade ago denounced Ben Bernanke for debauching the currency and risking an explosion of inflation via quantitative easing, And much better than the ravings of those yahoos, including President Obama, Who said nearly a decade ago that the United States government needed to freeze spending because it needed to tighten its belt just as American households had been forced tighten theirs.
In most ways, Modern Monetary Theory—Functional Finance—is just macroeconomic common sense: We do not like high unemployment, we do not like excessive inflation, so the government should make it it’s first priority to use it tools of economic management so that we do not experience either, and maybe it needs to be a little bit clever In win and how it uses fiscal and when and how it uses monetary policy To keep the task of financing the national debt from becoming an undue or even an unsustainable burden.
So what can go wrong with MMT? Three things can go wrong:
- MMT implicitly assumes that the debt market is efficient—that if the government debt gets on an unduly burdensome and unsustainable path, we will see that immediately in high interest rates. If that is not true, the government and the economy can face one hell of a mess should a bubble in government bond prices develop and then collapse. Cf. Greece.
- MMT implicitly assumes that wealth-owners react rapidly when they see trouble ahead—that when investors conclude that the government cannot or will not balance its books without ultimate high inflation, inflation will jump immediately.
- MMT implicitly assumes that extra financial leverage generated by the high values of collateral assets does not serve as a significant source of risk—that it is only on a small scale that investors will borrow foolishly just because they can.
If any of these three implicit assumptions are false, then policies that are good according to MMT can be bad in reality: Interest rates low enough to make financing government debt easy may generate an economy prone to financial collapse and disaster. Today’s installation that may not be a good enough warning sign of long run fiscal policy unsustainability. Collapses in government bond bubbles may generate “sudden stops” that require extremely rapid the school adjustment that the political system cannot face.
Nevertheless, if one must choose between MMT on the one hand and the high end risers of either monetary stringency or fiscal austerity on the other, choose MMT. It is closer to being an accurate view. We do seek a circular flow of spending, production, and incomes both high enough to keep there from being unnecessary unemployment and also being low enough so that prices and inflation are not surprisingly and distressingly high. This is a modest goal, not one pushed out of reach by some malign and austere economic logic.
DeLong: https://www.bradford-delong.com/2019/01/what-is-modern-monetary-theory.html
Monday, October 29, 2018
Jeff Saut 10.29.18
The Perfect Storm
...the perfect storm has hit the equity markets over the past month. However, we had an early warning of such events when, on October 2, 2018, our short-term proprietary model registered a “sell signal” and we said to sell trading positions. Regrettably, our models do not tell us how big a decline is in the offing, or how big the rally will be on a “buy signal.” The perfect storm was caused by a trifecta of news. First, China wanted to hurt the U.S., defend its currency (the renminbi), and boost its economy. As previously stated, China can do this with one maneuver. Sell Treasuries, which raises interest rates in the U.S., hurting the consumer and potentially hurting President Trump right in front of the mid-term elections. When they sell Treasuries, they receive U.S. dollars that can be used to buy renminbi and support their currency. They flush the purchased renminbi into their economy and presto, it hopefully juices it up. Second, the Fed is raising interest rates for multiple reasons. The economy is strong and the Fed is attempting to get to a “neutral rate” in case the economy softens, so they will have some room to lower rates to stave off a recession. And three, did you notice how the equity markets turned sloppy when the “nose counters” said there is near a 100% probability the Democrats will take the House of Representatives?
That trifecta has caused the D-J Industrials (INDU/24688.31) to fall into a “selling stampede.” As often noted, such stampedes tend to last 17-25 sessions. While it is true some have lasted 25-30 sessions, it is rare to see one go for more than 30 sessions. For the record, today is session 18, so the anticipated trading decline should be approaching a decent bottom. In fact, we think the equity markets are near their best “buy spot” since 2016. So let’s assess the damage.
The S&P 500 is now down 8.8% for the month with three sessions left in trading. If nothing changes from here, this will go down as the eighth worst October since the 1920s. Since 1980, this will be the third worst October, only beaten in 1987 and 2008. Regrettably, bad Octobers have tended to be followed by not good Novembers. That would foot with our belief that the mid- November energy peak should mark a significant low for the equity markets. On an upbeat note, December has tended to be a recovery month punctuated by the Santa rally. One thing for certain is that the long-term uptrend line from the February 2016 lows has been broken (chart 1, page 2), as has the same line in the NASDAQ (chart 2, page 3).
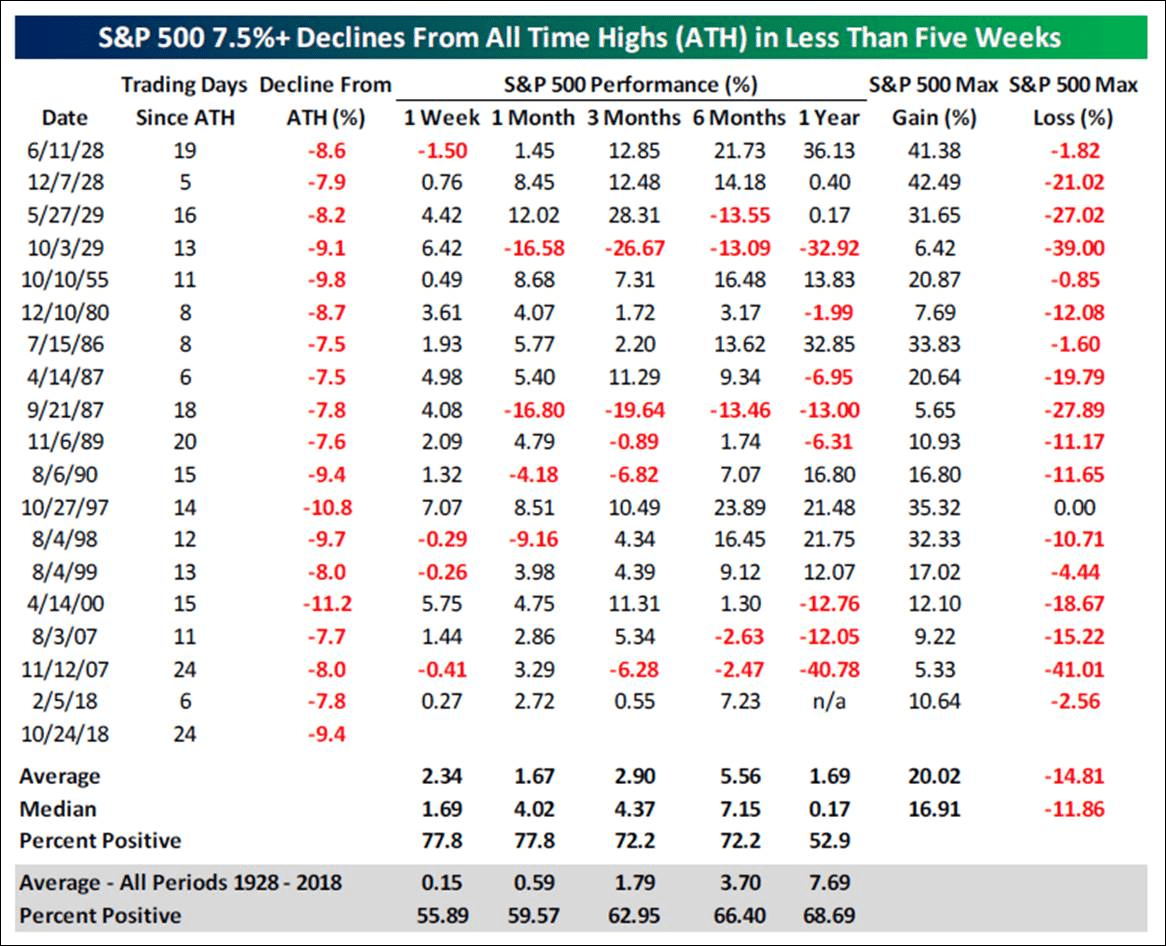
The S&P 500 (SPX/2658.69) has declined quickly, and said decline has been extreme. As of mid-week, the index was off about 9.4% from its all-time high in a mere 24 trading sessions. According to our friend at the Bespoke organization:
In the history of the S&P 500, this is only the 19th time that the S&P 500 has declined more than 7.5% from an all-time high (ATH) in less than five weeks (25 trading days). The table (chart 3, page 3) highlights each of those prior occurrences along with the S&P 500’s performance going forward at different intervals over the next year. Over the next week as well as the next one, three, and six months, using both average and median returns, the S&P 500’s return was collectively better than the average for all periods since 1929. . . . Unfortunately, we simply can’t know for sure whether the S&P will bounce back, trend sideways, or continue lower in the months ahead. Anyone that tells you they do know is not to be trusted. We can use history as a guide as we always do, but ultimately the market will move going forward based on how future earnings and economic data plays out based on factors like interest rates, trade policy, etc. All we can really do when we’re leaning more bearish is remain extra vigilant and stay on the side-lines until a more positive trend is established.
Plainly, I agree with the astute folks at Bespoke and would emphasize that I have been on the “sidelines” for trading accounts since the October 2, 2018 “sell signal” from my short-term proprietary model. Our sense remains there will be a significant low around the mid-November energy peak, but the question will be are we going to see a “selling climax” bottom (easy to identify), or a “selling dry up” bottom (much more difficult to identify). The ideal bottoming pattern would be for some kind of sharp “throwback” rally beginning this week, which fails, leading to lower lows into the mid-November energy peak. And that certainly could happen with the SPX majorly oversold with only 10.1% of the S&P 500 stocks above their 50-day moving averages (DMAs), while a mere 32.1% are above their respective 200-DMAs. Likewise, the New Highs over New Lows is deeply oversold on a trading basis.
Of interest is what one savvy portfolio manager told us last week. He thinks that the “machines” (algorithms) have taken over. To wit, when the SPX broke below its uptrend line at 2850, the “machines” were told to go from buying the dips to selling the rallies. In thinking about it, that makes a lot of sense, because when the selling abates and stocks try to “lift,” that lift is met with additional selling. Again, we have seen that reoccurring pattern ever since the SPX broke the uptrend line at 2850 in early October.
The call for this week: We look for a short-term trading bottom this week given the oversold nature of the equity markets. The ideal pattern would be for a sharp throwback rally that fails, leading to new short-term lows around the mid-November energy peak that should mark a major low with stocks trading higher into next year. While I abandoned trading positions on the October 2 “sell signal,” I have not disturbed long-term investment positions, believing we remain in a secular bull market that has years left to run. As our pal Leon Tuey (retired technical analyst extraordinaire) wrote last week:
Great news! The market is grossly oversold and the sentiment indicators are giving super bullish readings (excessive pessimism). On October 8, I opined that the peak selling intensity has been witnessed and the healing process has commenced and investors were advised to redeploy cash, particularly on further weakness. The world is unfolding as it should! Ignore the black headlines and redeploy cash.
On a separate note, and to respond to numerous emails, as of now there has been NO Dow Theory “sell signal.” For that to happen would require the D-J Industrials to break below their March 2018 closing lows, and the D-J Transports would have to confirm with a break below their November 2017 closing lows. This morning, the preopening S&P 500 futures are better by some 10 points on takeover news, as traders play for the expected Monday rally and October performance gaming.
Source: Bespoke Investment Group
...the perfect storm has hit the equity markets over the past month. However, we had an early warning of such events when, on October 2, 2018, our short-term proprietary model registered a “sell signal” and we said to sell trading positions. Regrettably, our models do not tell us how big a decline is in the offing, or how big the rally will be on a “buy signal.” The perfect storm was caused by a trifecta of news. First, China wanted to hurt the U.S., defend its currency (the renminbi), and boost its economy. As previously stated, China can do this with one maneuver. Sell Treasuries, which raises interest rates in the U.S., hurting the consumer and potentially hurting President Trump right in front of the mid-term elections. When they sell Treasuries, they receive U.S. dollars that can be used to buy renminbi and support their currency. They flush the purchased renminbi into their economy and presto, it hopefully juices it up. Second, the Fed is raising interest rates for multiple reasons. The economy is strong and the Fed is attempting to get to a “neutral rate” in case the economy softens, so they will have some room to lower rates to stave off a recession. And three, did you notice how the equity markets turned sloppy when the “nose counters” said there is near a 100% probability the Democrats will take the House of Representatives?
That trifecta has caused the D-J Industrials (INDU/24688.31) to fall into a “selling stampede.” As often noted, such stampedes tend to last 17-25 sessions. While it is true some have lasted 25-30 sessions, it is rare to see one go for more than 30 sessions. For the record, today is session 18, so the anticipated trading decline should be approaching a decent bottom. In fact, we think the equity markets are near their best “buy spot” since 2016. So let’s assess the damage.
The S&P 500 is now down 8.8% for the month with three sessions left in trading. If nothing changes from here, this will go down as the eighth worst October since the 1920s. Since 1980, this will be the third worst October, only beaten in 1987 and 2008. Regrettably, bad Octobers have tended to be followed by not good Novembers. That would foot with our belief that the mid- November energy peak should mark a significant low for the equity markets. On an upbeat note, December has tended to be a recovery month punctuated by the Santa rally. One thing for certain is that the long-term uptrend line from the February 2016 lows has been broken (chart 1, page 2), as has the same line in the NASDAQ (chart 2, page 3).
The S&P 500 (SPX/2658.69) has declined quickly, and said decline has been extreme. As of mid-week, the index was off about 9.4% from its all-time high in a mere 24 trading sessions. According to our friend at the Bespoke organization:
In the history of the S&P 500, this is only the 19th time that the S&P 500 has declined more than 7.5% from an all-time high (ATH) in less than five weeks (25 trading days). The table (chart 3, page 3) highlights each of those prior occurrences along with the S&P 500’s performance going forward at different intervals over the next year. Over the next week as well as the next one, three, and six months, using both average and median returns, the S&P 500’s return was collectively better than the average for all periods since 1929. . . . Unfortunately, we simply can’t know for sure whether the S&P will bounce back, trend sideways, or continue lower in the months ahead. Anyone that tells you they do know is not to be trusted. We can use history as a guide as we always do, but ultimately the market will move going forward based on how future earnings and economic data plays out based on factors like interest rates, trade policy, etc. All we can really do when we’re leaning more bearish is remain extra vigilant and stay on the side-lines until a more positive trend is established.
Plainly, I agree with the astute folks at Bespoke and would emphasize that I have been on the “sidelines” for trading accounts since the October 2, 2018 “sell signal” from my short-term proprietary model. Our sense remains there will be a significant low around the mid-November energy peak, but the question will be are we going to see a “selling climax” bottom (easy to identify), or a “selling dry up” bottom (much more difficult to identify). The ideal bottoming pattern would be for some kind of sharp “throwback” rally beginning this week, which fails, leading to lower lows into the mid-November energy peak. And that certainly could happen with the SPX majorly oversold with only 10.1% of the S&P 500 stocks above their 50-day moving averages (DMAs), while a mere 32.1% are above their respective 200-DMAs. Likewise, the New Highs over New Lows is deeply oversold on a trading basis.
Of interest is what one savvy portfolio manager told us last week. He thinks that the “machines” (algorithms) have taken over. To wit, when the SPX broke below its uptrend line at 2850, the “machines” were told to go from buying the dips to selling the rallies. In thinking about it, that makes a lot of sense, because when the selling abates and stocks try to “lift,” that lift is met with additional selling. Again, we have seen that reoccurring pattern ever since the SPX broke the uptrend line at 2850 in early October.
The call for this week: We look for a short-term trading bottom this week given the oversold nature of the equity markets. The ideal pattern would be for a sharp throwback rally that fails, leading to new short-term lows around the mid-November energy peak that should mark a major low with stocks trading higher into next year. While I abandoned trading positions on the October 2 “sell signal,” I have not disturbed long-term investment positions, believing we remain in a secular bull market that has years left to run. As our pal Leon Tuey (retired technical analyst extraordinaire) wrote last week:
Great news! The market is grossly oversold and the sentiment indicators are giving super bullish readings (excessive pessimism). On October 8, I opined that the peak selling intensity has been witnessed and the healing process has commenced and investors were advised to redeploy cash, particularly on further weakness. The world is unfolding as it should! Ignore the black headlines and redeploy cash.
On a separate note, and to respond to numerous emails, as of now there has been NO Dow Theory “sell signal.” For that to happen would require the D-J Industrials to break below their March 2018 closing lows, and the D-J Transports would have to confirm with a break below their November 2017 closing lows. This morning, the preopening S&P 500 futures are better by some 10 points on takeover news, as traders play for the expected Monday rally and October performance gaming.
Chart 1
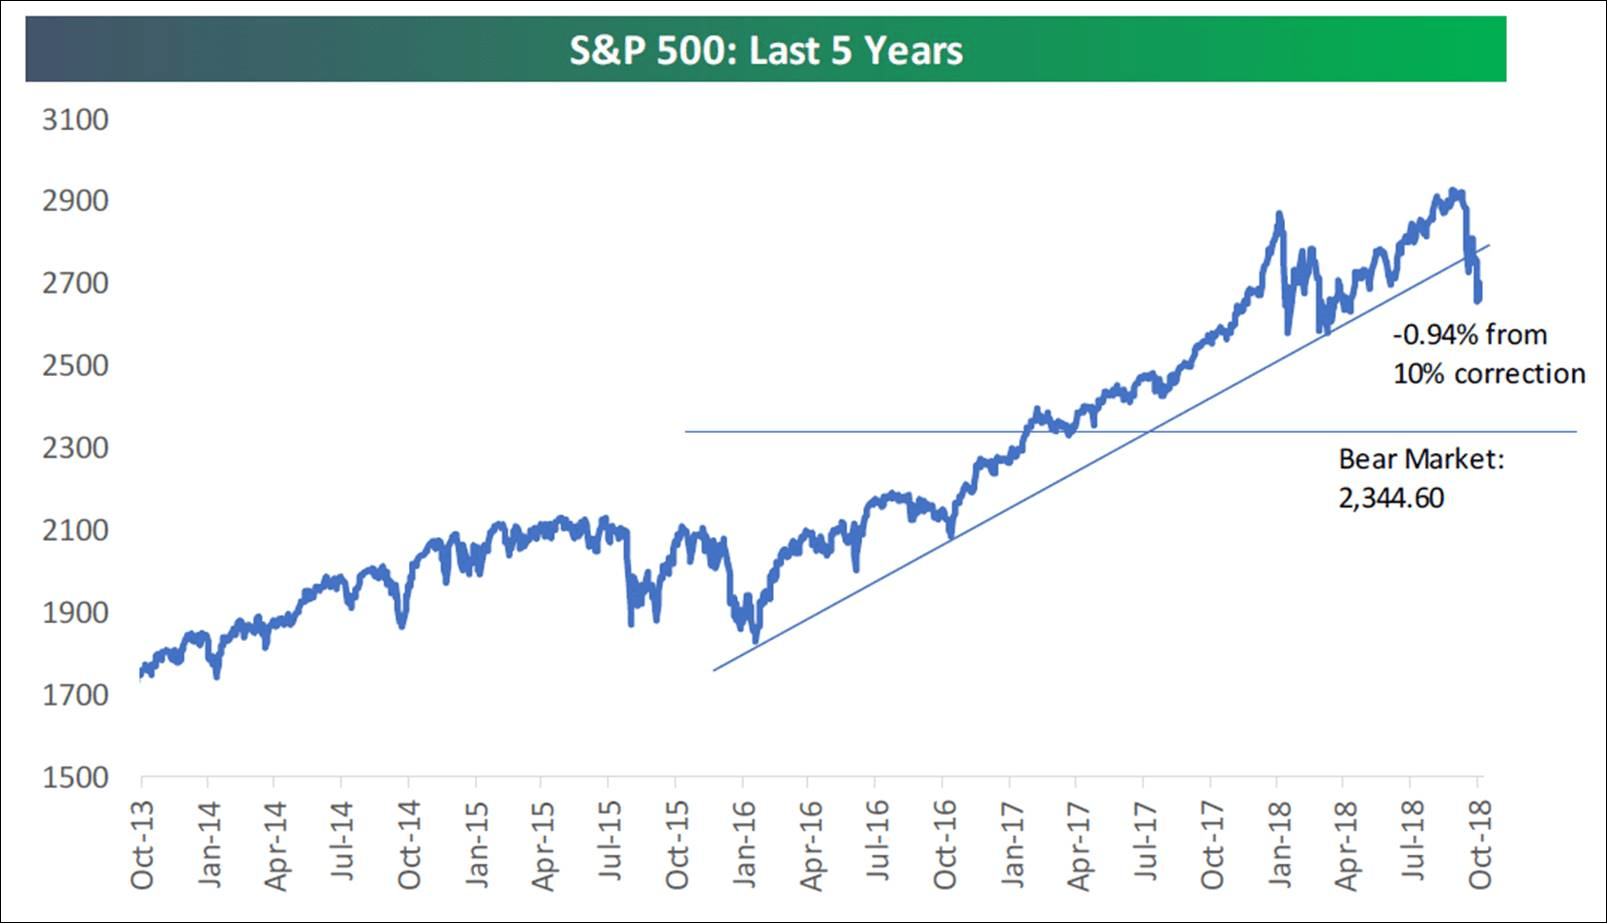
Chart 2
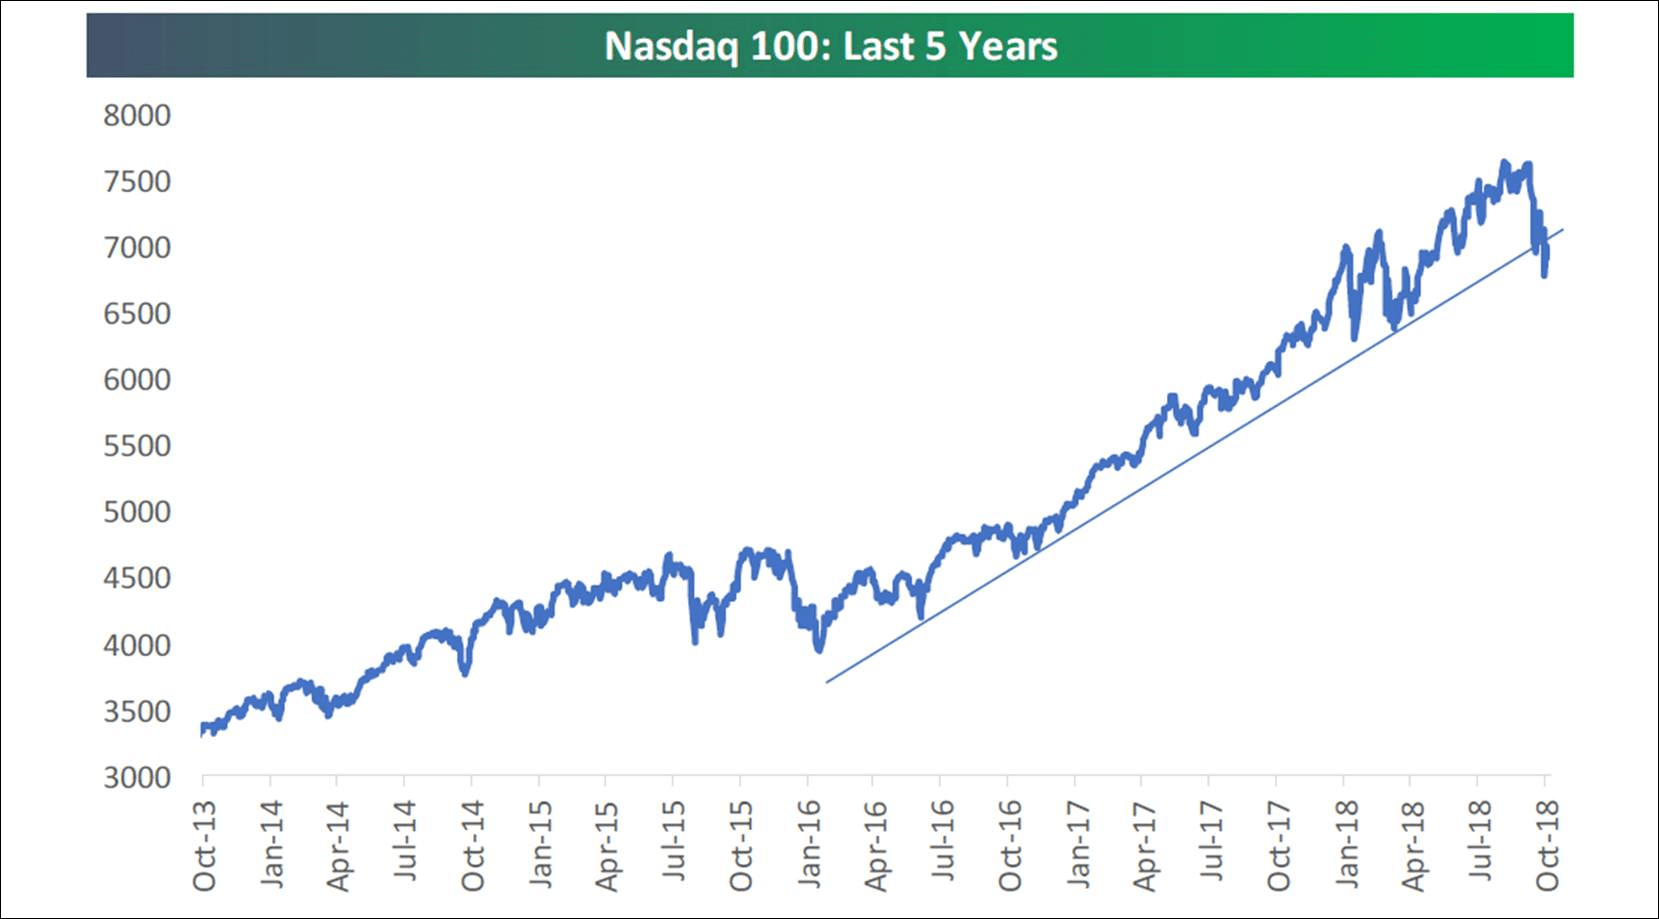
Chart 3
Tuesday, October 9, 2018
Jeff Saut 10.8.18
...according to our models the past two sessions were pretty critical in that they should have vaulted to the upside and that just has not happened. This lack of direction, and subsequent failure to foster an upside breakout, makes us have to consider that on a trading basis, the mid-November energy peak, instead of being an upside inflection point, may just mark the end of a downside reaction low. Accordingly, we are recommending selling some trading positions, yet we are undeterred on our secular bull market theme that has years left to run...
Clearly, interest rates have been rising because of the strong economy and the concurrent decent economic numbers. Take last week’s employment report. The last time the U.S. unemployment rate was 3.7% was in December 1969 as the economy was overheating, inflation was soaring, and a recession was soon to follow. Could that happen again? It is very unlikely in the near term, as the Present Situations Index is definitely not telegraphing it. However, fears of such a sequence materialized last week, causing a slide in stocks. As for support levels, the SPX’s 50-day moving average (DMA) is at 2876 and the 100-DMA is at 2817. We do not expect this zone to be violated on the downside.
One stock that has become of interest to us, because we have numerous portfolio managers mentioning it, is Viking Therapeutics (VKTX/$15.57/Outperform). As our fundamental analyst writes:
Viking Therapeutics, Inc. is a clinical-stage biopharmaceutical company that engages in the development of novel therapies for patients suffering from metabolic and endocrine disorders (read fatty livers). Its clinical program, VK5211, treats patients recovering from non-elective hip fracture surgery. It also specializes in development of VK2809 and VK0214.
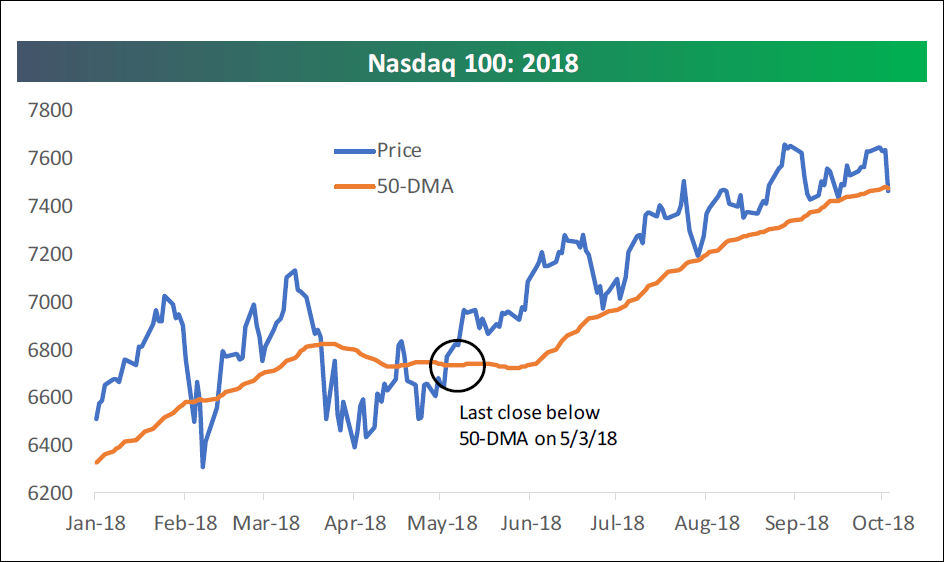
The call for this week: Our short-term model registered a “soft” cautionary signal after Tuesday’s closing bell. The McClellan Summation Index is below zero for the first time in six months and has also turned negative with stocks near their all-time highs. Meanwhile, the NASDAQ 100 closed below its 50-DMA for the first time since May (chart 2, page 3). That is likely driven by the FANG stocks on the revelation that China has implanted tiny “spy chips” in many of the FANG stocks’ servers (chart 3, page 3). Support levels for the SPX are the 50-DMA at 2876 and the 100-DMA at 2817. We do not expect this zone to be violated. However, even a pullback to 2817 would not “dent” this secular bull market. This week there is a fairly strong negative energy blast due, but it should subside by week’s end.
One stock that has become of interest to us, because we have numerous portfolio managers mentioning it, is Viking Therapeutics (VKTX/$15.57/Outperform). As our fundamental analyst writes:
Viking Therapeutics, Inc. is a clinical-stage biopharmaceutical company that engages in the development of novel therapies for patients suffering from metabolic and endocrine disorders (read fatty livers). Its clinical program, VK5211, treats patients recovering from non-elective hip fracture surgery. It also specializes in development of VK2809 and VK0214.
Chart 1
Click here to enlarge
Source: FactSet
Chart 2
Click here to enlarge
Source: Bespoke Investment Group
Chart 3
Wednesday, October 3, 2018
Jeff Saut 10.2.18
As mentioned on numerous occasions, if nothing else, if investors only understand and appreciate the following, they will always be on the right side of the market and will never be influenced by others’ opinions or news headlines:
- Investors must understand the role of the U.S. central bank (the Fed). The U.S. Federal Reserve System was created in 1913 to perform all roles monetary, but one of their key statutory (written in law) mandates is to “To maintain orderly economic growth and price stability.” This agency has more and better information on the economy than anyone in the world. It was not created to promote hyperinflation or to create depressions. The Fed’s key mandate must be clearly understood and appreciated.
- The stock market is a leading economic indicator. The economy does not lead the stock market. Hence, once these two points are clearly understood and remembered, the market’s logic becomes apparent. Hence, when the economy slows and heads into a recession, the Fed will ease and will keep easing until the economy responds (remember, that’s their mandate). The stock market, being a leading economic indicator, will have bottomed 6-9 months before the recovery begins, not after. For example, "the market" bottomed in October, 2008 and the recession ended at the end of June, 2009 and a [market] recovery commenced, eight months ahead of the [economic] recovery. Conversely, when the economy overheats; inflation surges; and speculation is rampant, the Fed will tighten by draining liquidity from the system and raise interest rates in an attempt to cool the economy. The stock market, being a leading economic indicator, will head south long before the onset of a slowdown or recession, not after. This chain of logic is so simple that anyone with an IQ slightly above room temperature would understand it. Yet, most on Wall Street with umpteen degrees and decades of experience can’t figure it out.
IDENTIFYING A MAJOR MARKET BOTTOM
- The economy is in bad shape; jobs are hard to find; and headlines are black. Capacity utilization plunges. Talk of depression is widespread. The talking heads will declare “this time is different. They (the Fed) has lost control.”
- Investors are crying the blues as their portfolios are showing huge losses. Worldwide, investors panic and a sense of despair and hopelessness prevails. Brokers are sleeping like babies; theywake up every hour and cry.
- The Fed eases by injecting liquidity into the system and lowers the Discount rate three or more times in succession and will keep easing until the economy responds.
- The Classic Yield Curve (13-week T-bill Yield vs. 30-year T-bond Yield) starts to steepen (short rates below the long rates).
- The interest-sensitive sectors such financials, bonds, preferred shares, utilities bottom and start to head North while the major market averages continue to head south. Mesmerized by the decline in the market indices, investors are unaware that a “rolling” bottom has begun.
- As the Fed eases further, the growth and consumer discretionary issues bottom while the major market averages move yet to new lows.
- The market becomes grossly undervalued.
- Investors are sitting on a mountain of cash and hold little equities. They have no appetite for stocks.
- A selling climax occurs as investors panic. Seized by fear, investors “throw the baby out with the bathwater” as they can’t bear the loss anymore and are convinced the world will end. An emotional catharsis occurs and stocks move from weak hands into strong hands.
The bear market ends and a bull market begins.
IDENTIFYING A MAJOR MARKET TOP
- The economy is booming; workers are hard to find; and headlines are glowing. Capacity utilization is running full tilt.
- Investors are euphoric and the stock market becomes topic du jour at cocktail and dinner parties. Waiters, taxi drivers, bartenders, and shoeshine boys are giving clients hot tips; they think they are market mavens. Everyone is a genius and have the keys to Fort Knox.
- Euphoria reins. Investors are heavily invested in equities and hold little cash.
- Stock brokers, confusing their own genius with a bull market, buy Ferraris and Lamborghinis and dine in uber expensive restaurants.
- The economy overheats, inflation surges; and speculation is rampant. Consequently, in their attempt to cool the economy, the Fed tightens meaningfully by draining liquidity from the system and raises interest rates numerous times.
- The market becomes grossly overvalued.
- After a long period of flattening, the Classic Yield Curve is inverted (short rates higher than long rates). Then, as the economy deteriorates, the yield curve starts to steepen (short rates start to move below the long rates).
- Interest–sensitive sectors such as financials, bonds, preferred shares, utilities along with consumer discretionary, start to head south. Meanwhile, dragged up by the late-cycle issues, the major market averages keep moving to new highs. Investors are lulled by the new highs in the market indices, not realizing the broad market is already heading into a bear market. Not surprisingly, the various Advance-Decline Lines start to head south 3-6 months before the major market averages. New Highs start to contract and New Lows expand.
- Finally, the major market averages top and join the rank and file by heading in a southeasterly direction.
The call for this week: We are on the West Coast seeing accounts, speaking at conferences, and doing gigs for our financial advisors and their clients. If past is prelude the markets will do something in our absence. Unsurprisingly, last week we received no less than 30 emails about the ten Hindenburg Omens that have been registered over the past two weeks (read: telegraphing a stock market crash). That indictor, however, is being triggered by the selling of interest-rate-sensitive ETFs and closed-end bond funds. Meanwhile, as we wrote last Friday:
“[Next] week we could see more powerful upside energy, but at this point it’s not looking all that powerful either. It’s more likely we’ll see more energy come into the market as we get closer to the [mid] November energy peak.”
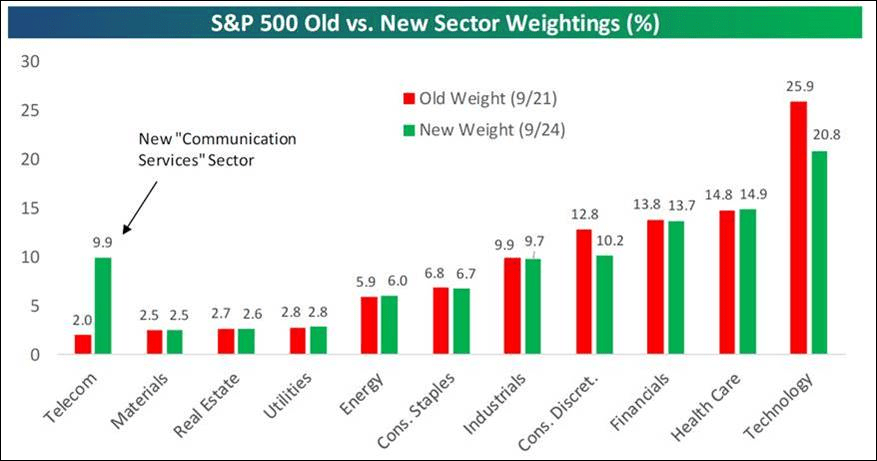
Quite frankly, given the low energy mix stocks typically “drift,” which is exactly what happened last week as we suggested. It may be more of the same this week, but should develop into something more powerful to the upside over the next few weeks. As a sidebar, the recent changes in S&P sector weightings are worth mentioning. Of particular note is that Telecommunication has gone from a 1.98% weight to a 9.9% weight (see chart below).
Yesterday, the equity markets caught an unexpected tailwind, although we have repeatedly said Canada was going to “blink” on NAFTA, and we think China will do the same. Evidently, the equity markets expect the same, but yet the equity markets could not hold on to yesterday’s gains into the closing bell. That is consistent with our upside “drift” call. Of our unpublicized letter yesterday, which is being published today, a day late, we stand by this strategy and embrace our upside trading target of 2980 – 3000 despite “calls” of this is JUST a range-bound stock market . . . GOOD GRIEF!
Chart 1
Very quick, very dirty history of the crisis
Misunderstanding Credit and Housing Crises: Blaming the CRA, GSEs #10YEARSAGO ritholtz.com/2008/10/misund…
Vitus Capital
Replying to @ritholtz
A GREAT new screed about the crisis! Causes, motivations, etc. This should be made into a book! Wait... One big thing - which is hard to discuss - is the factor of the structure of the debt. EG, the first big CDO championed by Blythe Masters at JPM /1
Replying to @ibilln @ritholtz
...started out not matching it's performance profile. IE, beating your model of piles of disparate financial vehicles into something that fails along a Bell curve is, um, hard. In fact, CDO's in general never worked. The -substance- of the crises was that shadow banks 2/
Replying to @ibilln @ritholtz
and regular banks were caught in a downdraft in 2007 when they all, knowing what kind of assets they all had, stopped short-term (repo) loans to each other. More bluntly, they knew that they all were a blink away from insolvency All due to misunderstanding normal distributions/3
Thursday, September 6, 2018
Jeff Saut. See "Call for this week" at bottom
The Endless Summer September 4, 2018
The Endless Summer (1966) is the crown jewel to ten years of Bruce Brown surfing documentaries. Brown follows two young surfers around the world in search of the perfect wave, and ends up finding quite a few in addition to some colorful local characters (Endless Summer). Well, summer has officially ended with the Labor Day celebration. Traditionally, for Americans it marks a change in attitudes and latitudes, from leisure, play and vacation, to work, school, and more serious attitudes. With the entrance of fall comes September and October. While October is considered to be the “cruelest” month for investors, September is actually the worse month statistically for the stock market. That said, October has been the most spectacular with two crashes, the end of the 1990 bear market, the “Crashette” of 1989, and a few nasty setbacks in the 1970s. We reflected on the endless summer on our recent six hour plane ride from San Francisco. Our problem was that we were sitting next to a person who did not bring any reading material. All he wanted to do was talk. In a bar, or other situations, we are always able to get up and move to another location, but on a plane you are trapped. Normally, when confronted by someone who is interested in talking, and asks us what we do, we tell them we are auditors for the IRS and that usually ends the conversation. Failing that, we revert to writing and tell our inquisitor we have a deadline and cannot talk. Thus defensive writing was invented.
During the plane ride we also recalled some comments from our departed friend, Ray Devoe, who was considered to be one of the best writers, and best strategists, on Wall Street. It was back in 1997 that Ray wrote:
Against the Gods by Peter Bernstein is probably the most difficult books I have ever read. Not that the style or content makes it hard to read, but so many points made by Peter got me thinking extensively and then writing out lengthy notes to myself about the points he made. Perhaps “difficult” is not appropriate – if “time consuming,” “provocative,” and “thought inducing” could be rolled into one phrase that might do it. Throughout the book he makes the point that risk cannot be avoided, only shifted. This is not a book that “New Era” investors would enjoy. One quotation that every new investor should keep in mind is, “At the extremes, the stock market is more likely to destroy fortunes than make them. The stock market can be a risky place if one does not manage risk.” This will come as heresy to those who believe that 1) the only risk is being out of the market and/or 2) there is no risk in stocks held over the longer term, only short-term volatility.
The book states unequivocally that individuals are risk averse financially. They will always attempt to avoid risk WHEN THEY ARE AWARE THAT RISKS EXIST. His conclusion is that “Losses will always loom larger than gains,” which has been reinforced by behavioral scientists. The public may have one attitude about pain when paper profits are being eroded, but when actual losses are incurred the pain can become physical. I know this from personal experience. Steve Leuthold’s “Perception for the Professional” cites financial behaviorists Amos Tversky and Daniel Kahneman, who have estimated that the pain of losses is over three times as great as the pleasure from gains.
We revisit Ray Devoe’s sage writings this morning because we continue to stress how important it is to “manage risk.” We emphasized this point following the Dow Theory “sell signal” of September 23, 1999, and again with the Dow Theory “sell signal” of November 21, 2007.
Most recently, we advised that trading types raise some cash in January of this year and then put that trading capital back to work in early February after the ~10% decline. Further, last Tuesday we wrote:
It would not surprise to see the S&P 500 stall around the 2900 level, but eventually it is going to poke through 2900 and travel above 3000, which we have said repeatedly was going to happen in these missives since the February 9th undercut low. And, while the short-term market energy has been used up, there is still plenty of intermediate “internal energy” built up to power things higher.
Yet last week the equity markets did indeed “stall” and our sense is the “energy mix” is likely going to continue to keep the equity markets in stall-mode for the near term. However, since the February 9th low (2532) the S&P 500 (SPX/2901.52) has not stalled, crashed, or even stayed range-bound. Indeed, since that February low the SPX has gained some 15%, but the gains do not stop there. The technology sector has advanced 19.9% YTD, the consumer discretionary space has improved by 18.1%, and healthcare is better by 11.7%. Those have been our favored sectors, but alas our other favored sector, namely the financials, has lagged (+0.9%), which is a real surprise because the financials are just plain “cheap” (Chart 1). To reiterate, the way we suggest investing in said group is through the David Ellison funds (Hennessy Financial Funds) and Anton Schultz (RMB Financial Services Fund). Of course the sectors we have shunned, telecom, consumer staples, and utilities, have materially underperformed (Chart 2).
Also of note is that the SPX just had its best summer (May – August) since the March 2009 lows with a gain of 9.25% and we have been bullish. Moreover history shows that when the SPX is up 5%+ through August, the scary month of September has shown a positive return (Chart 2). Interestingly, with the SPX breaking out to new all-time highs, the stock market’s valuations are actually contracting. Given the excellent technical and fundamental conditions (Chart 3) it is tough not to be bullish! As we tend to do during earnings season, we screen for companies that beat on earnings and revenue estimates and raise forward guidance. They also must carry a positive rating from our fundamental analysts and screen well using our proprietary models. Two such names are: Analog Devices (ADI/$98.85/Outperform) and Splunk (SPLK/$128.15/Outperform). Another article we perused during our six hour flight noted, “Some 16.5 million passengers are expected to fly on U.S. airlines in the week-long Labor Day travel period, which started last Wednesday and runs through today.” That quip piqued our interest and caused us to look at the charts of the Raymond James’ airline research universe of stocks. The name that jumped out at us was Alaska Air (ALK/$67.49/Strong Buy), which is breaking out to the upside in the charts and has just turned green on our proprietary model (Chart 4).
The call for this week: Given the softer short-term internal “energy mix” it would be surprising if the SPX can initially vault above the 2930 – 2935 level immediately. Longer term, however, the energy mix is wildly bullish. Last week ALL of the Advance-Decline Lines we monitor registered new all-time highs; and, as the astute Lowry Research organization writes:
The balance of Supply and Demand remains positive, with the percentage spread between Buying Power and Selling Pressure reaching 31.1% this week, one of the most positive readings of the year and far above the 20.9% positive spread that accompanied the Jan. 26th high in the S&P 500. Thus, in terms of the key measures of Supply and Demand, this bull market remains healthy and with little of the evidence that typically precedes the formation of a major market top.
Friday, March 9, 2018
Noah Smith scifi books
Noah Smith scifi books
A Deepness in the Sky— Noah Smith (@Noahpinion) March 9, 2018
the Vorkosigan series
Permutation City
Cryptonomicon
Oryx & Crake
Hyperion + The Fall of Hyperion
Battle Royale
All the Birds in the Sky
Down & Out in the Magic Kingdom
Neuromancer
Lucifer's Hammer
The Uplift War
Kindred
Schismatrix
Metaplanetary
Friday, January 26, 2018
Jeff Saut Call of the Week
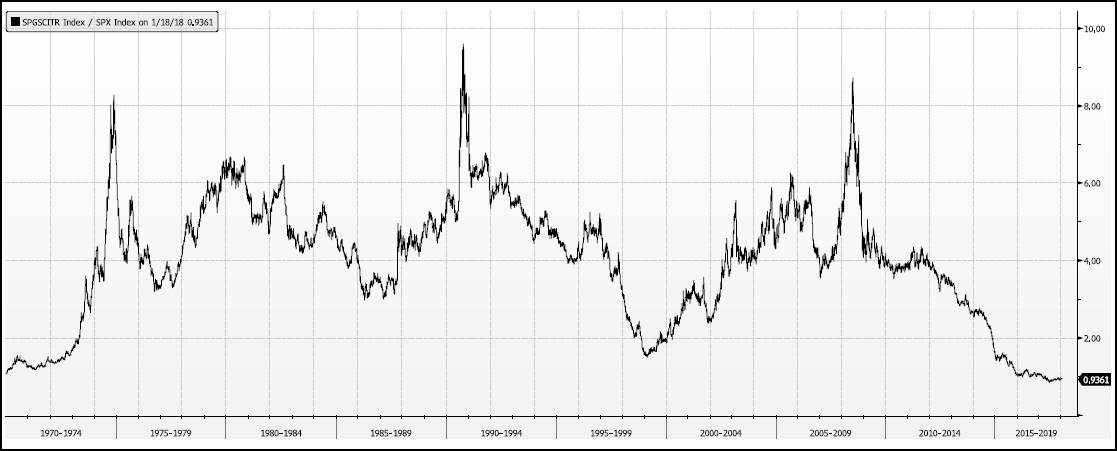
Jeff Saut... DoubleLine Capital’s Jeffrey Gundlach is recommending for 2018, namely emerging markets and commodities, themes we have been featuring for quite some time. Manifestly, commodities relative to stock are as cheap as they have been in a long time (see chart 1 below).
The call for this week: Friday’s option expiration usually leads to a lower Monday open for stocks on position squaring. That is what is happening this morning with the preopening futures down marginally. Our conversations with international accounts suggest they are more worried about the government shutdown than our domestic institutional accounts. Ergo, if stocks decline during the morning, look for a rally after the European close. The real question is, “Will U.S. investors continue to ignore the shutdown like they did in 2013?” 2800, 2767 (gap), 2750 (gap), 2736, 2723 (gap), 2714 (gap) on the S&P 500 Index are support levels.
Tuesday, January 23, 2018
Immigration - Noah Smith
A thread by Noah Smith
Immigration is the big issue in 2018. I've been writing about it for a while.
So here's a thread of articles, facts, and graphs that you can use in the immigration debate. First: Why immigration at all? Why do we need to bring newcomers into our country?
Economic reasons:
1. They pay for the retirements of the native-born.
2. They are highly entrepreneurial.
3. They help keep America the center of the world economy. (bloomberg.com/view/articles/…) Immigrants also help save declining towns, counties, and states. Immigration is the best hope for the Midwest and Northeast. (bloomberg.com/view/articles/…) Finally, Americans just LIKE immigrants.
The "nation of immigrants" thing isn't just elite propaganda. It's reflected in all the polls. (bloomberg.com/view/articles/…)
Now, let's address the arguments AGAINST immigration. The first argument against immigration is economic.
"Immigrants take jobs away from the native-born!"
"Immigrants lower native-born wages!"
Are these true?
Probably not. (bloomberg.com/view/articles/…) (bloomberg.com/view/articles/…)You may have heard that George Borjas of Harvard says immigration hurts native workers.
He does. But he's in the distinct minority. And the research methods he uses are often suspect.
The vast weight of evidence is against Borjas. (bloomberg.com/view/articles/…)The second argument against immigration is legal.
"We just want to enforce the law! We like LEGAL immigration, just not ILLEGAL!"
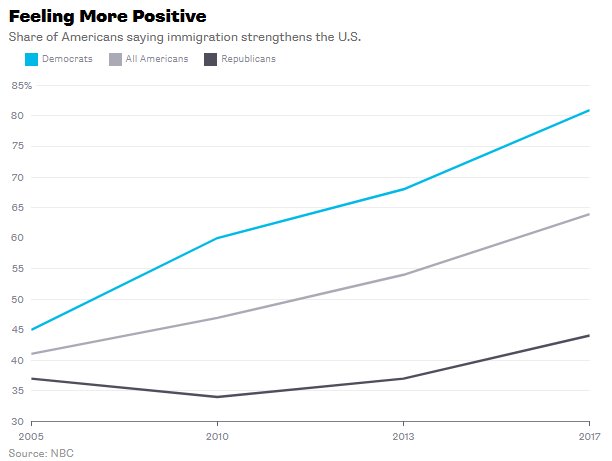
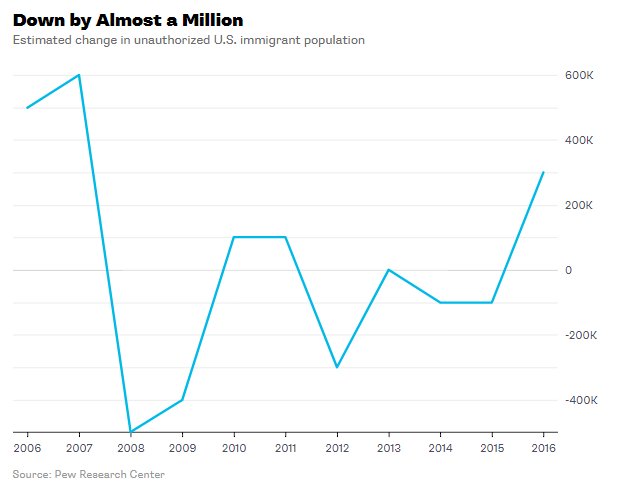
Well, guess what: The number of illegal immigrants living in America has actually FALLEN, not risen, over the last decade.
"Immigrants take jobs away from the native-born!"
"Immigrants lower native-born wages!"
Are these true?
Probably not. (bloomberg.com/view/articles/…) (bloomberg.com/view/articles/…)You may have heard that George Borjas of Harvard says immigration hurts native workers.
He does. But he's in the distinct minority. And the research methods he uses are often suspect.
The vast weight of evidence is against Borjas. (bloomberg.com/view/articles/…)The second argument against immigration is legal.
"We just want to enforce the law! We like LEGAL immigration, just not ILLEGAL!"
Well, guess what: The number of illegal immigrants living in America has actually FALLEN, not risen, over the last decade.
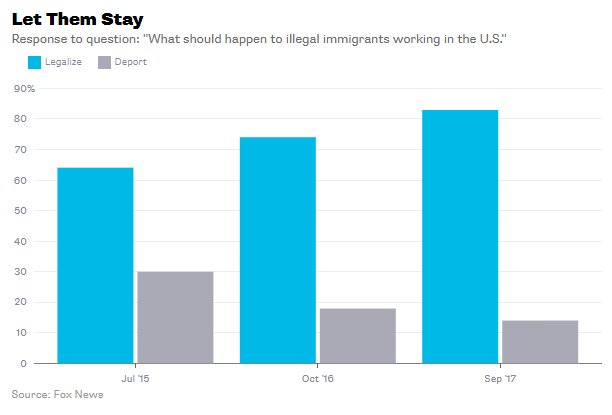
Furthermore, Americans favor a path to citizenship over deportation.
Enforcing the law is good, but most Americans agree it's not worth turning our society into a police state just to kick out people who live here.
Enforcing the law is good, but most Americans agree it's not worth turning our society into a police state just to kick out people who live here.
The third argument against immigration is fiscal.
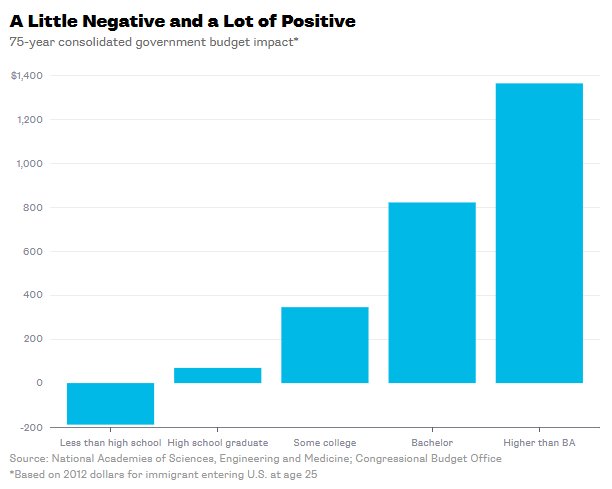
"Immigrants are a drain on government resources!"
As it turns out, all but the least educated immigrants are a net POSITIVE for government budgets. (bloomberg.com/view/articles/…)
"Immigrants are a drain on government resources!"
As it turns out, all but the least educated immigrants are a net POSITIVE for government budgets. (bloomberg.com/view/articles/…)
The fourth argument against immigration is cultural.
"Immigrants don't assimilate!"
Well, yes they do. (bloomberg.com/view/articles/…) Today's immigrants learn English just as fast (or faster than) previous waves.
What's more, today's immigrants intermarry at very high rates - a sure sign that they're integrating into America. (washingtonpost.com/news/wonk/wp/2…)

What's more, immigrants' political attitudes are similar to Americans' attitudes.
Immigrants are not importing foreign values that are going to displace traditional American values. (object.cato.org/sites/cato.org…) The fifth argument against immigration is racist.
"Immigrants come from shithole countries, so they'll make America a shithole too!"
Guess what: Immigrants from poor countries in Africa and elsewhere do really well in America. (bloomberg.com/view/articles/…) There are also some arguments I haven't written about. For example, the idea that immigrants bring crime into the U.S. (False! It's the opposite: )
To sum up: There are many good reasons to keep letting immigrants into the U.S., and to let in even more than we currently do.
There are few good reasons to tighten restrictions.
Happy debating!
There are few good reasons to tighten restrictions.
Happy debating!

Tuesday, March 28, 2017
Friday, March 24, 2017
AHCA passage: Chaos and death, but not the end of the world
It looks like the AHCA will pass. Fooey.
Well, it won't be the utter tragedy that we libs think it will be, but it will be bad.
Some quick things:
- We will go back to healthcare circa 2008:
- Employer-paid for workers, wherein, mostly, one gets coverage for pre-existing conditions, some amount of pre/postnatal care, etc
- Lousy, expensive insurance for individuals not covered by employer (self-employed, between jobs, laid-off, etc)
- For the poor, emergency rooms
- Medicaid will be canceled for all practical purposes..Some/many hospitals will probably go out of business, as they are not set up to handle the poor in volume
- Some if not many Insurance companies will go out of business due to inability to estimate future customer flow.
- It will be chaos for a year+ until it settles down
- Many will simply die due to unavailability of health care.
- Some states which can afford it, like California, will set up exchanges and mimic and maybe improve Obamacare. This will be good for California, but nationally will add to the chaos.
The optimist in me says that if California splits with the national “standard”, it will point the way to a bright new future, with things done right. But the reality is that, as usual, the middle of the country will be left behind, adding to the disunity already visible.
PS - if you are an economist, try modeling the California split.
Subscribe to:
Posts (Atom)